OpenTelemetry integration is optional and intended for advanced users with existing observability infrastructure. Most users won’t need this feature.
What is OpenTelemetry?
OpenTelemetry is an industry-standard observability framework that provides a unified way to collect and export telemetry data (metrics, logs, and traces). Cline’s OpenTelemetry support allows you to:- Export telemetry to your own systems
- Integrate with observability platforms like Datadog, New Relic, Grafana Cloud, etc.
- Maintain full control over your monitoring data
- Use your organization’s existing monitoring infrastructure
Supported Features
Cline supports OpenTelemetry’s OTLP (OpenTelemetry Protocol) export with:Metrics Export
Export metrics about Cline usage, performance, and errors
Logs Export
Export structured logs for debugging and analysis
Export Formats
Cline supports three OTLP export protocols:- gRPC (default, recommended)
- HTTP/protobuf
- HTTP/JSON
Configuration
OpenTelemetry is configured using Remote Configuration from the dashboard.Basic Setup
Enable OpenTelemetry, configure an OTLP endpoint and select a protocol: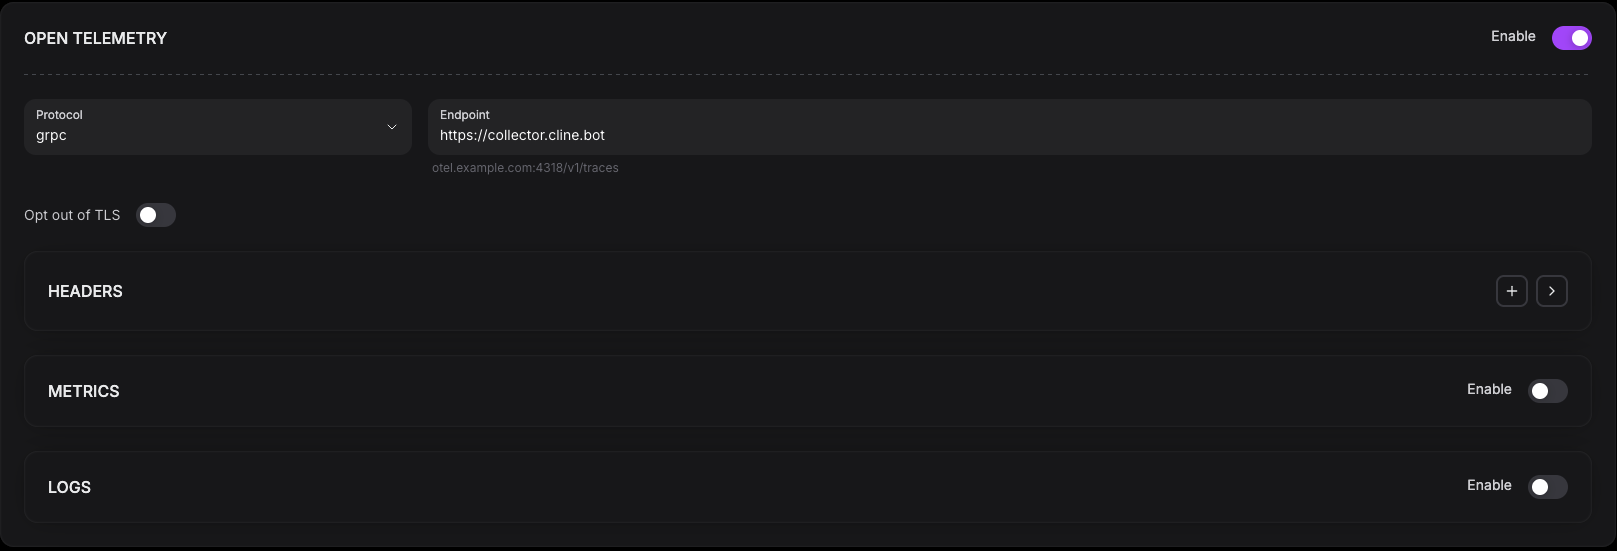
Advanced Configuration
You can add custom protocols and endpoints for both, logs and metrics. You can also configure the metrics export interval, and the logs batch size, batch timeout and max queue size.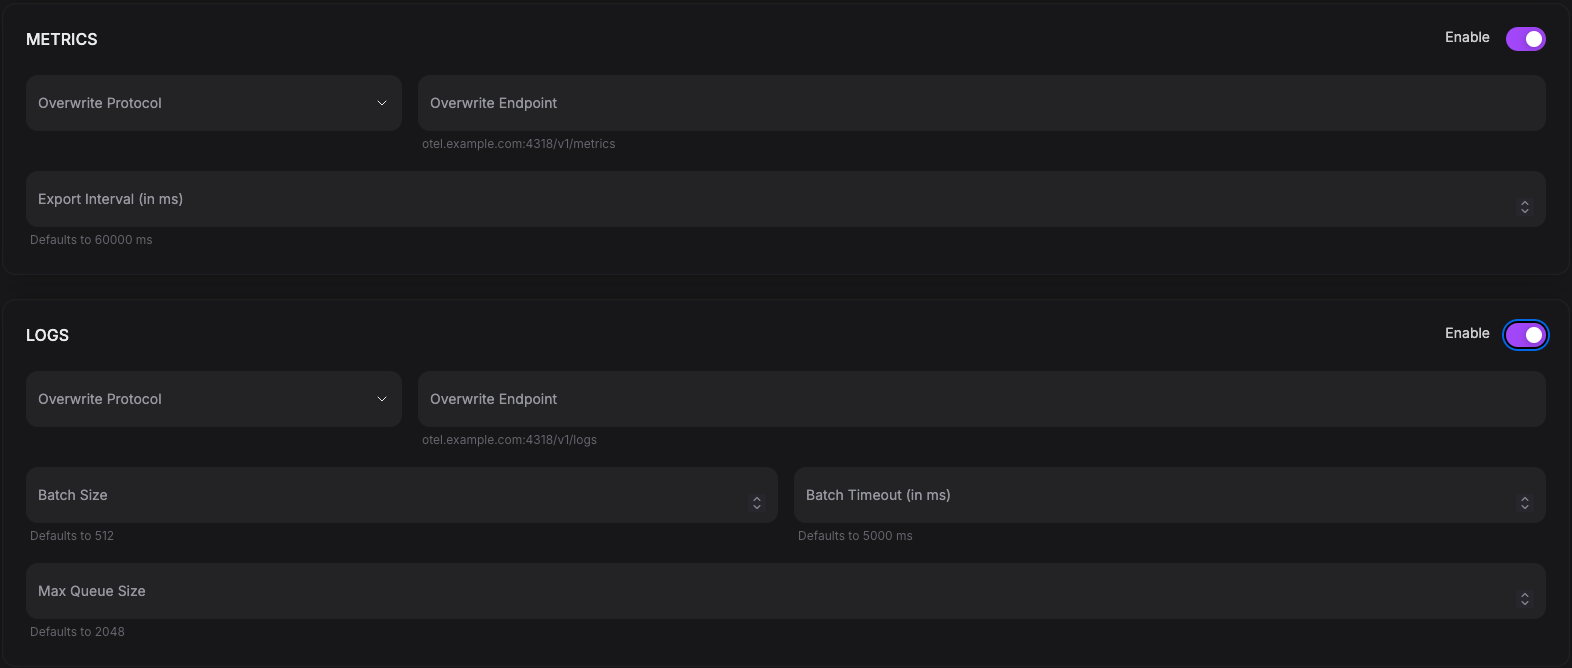
Integration Examples
Datadog
Export to Datadog using their OTLP endpoint: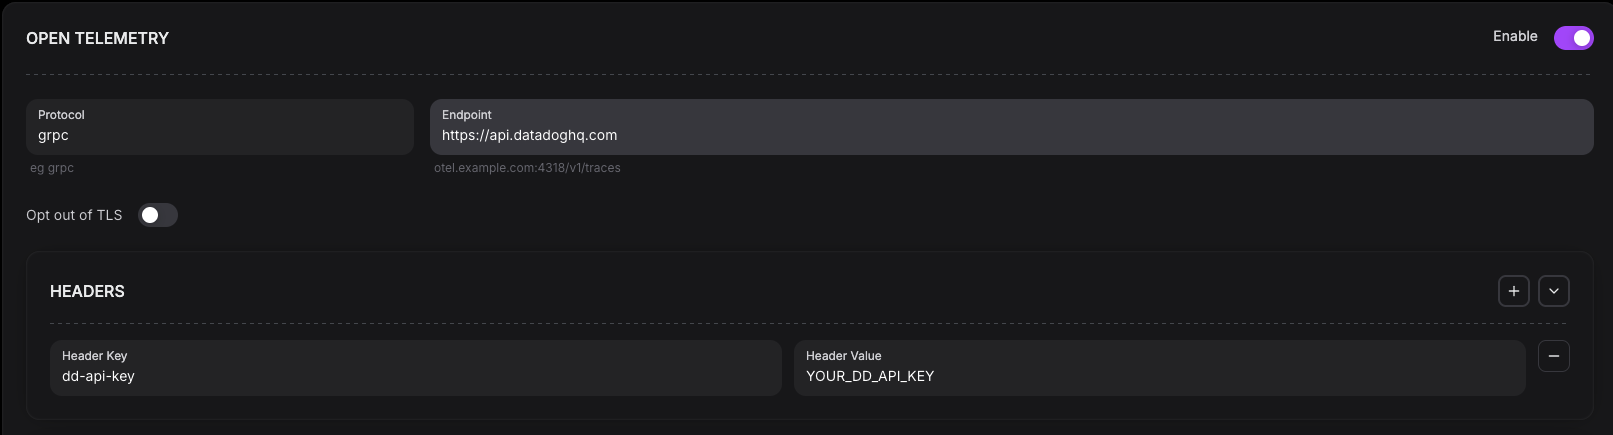
New Relic
Export to New Relic: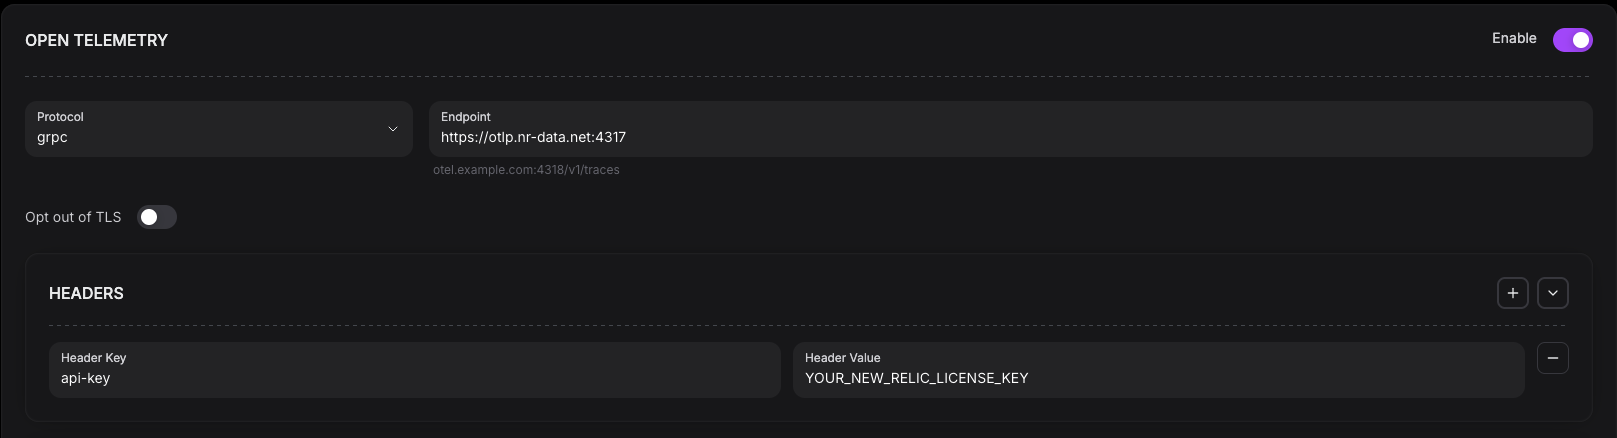
Grafana Cloud
Export to Grafana Cloud: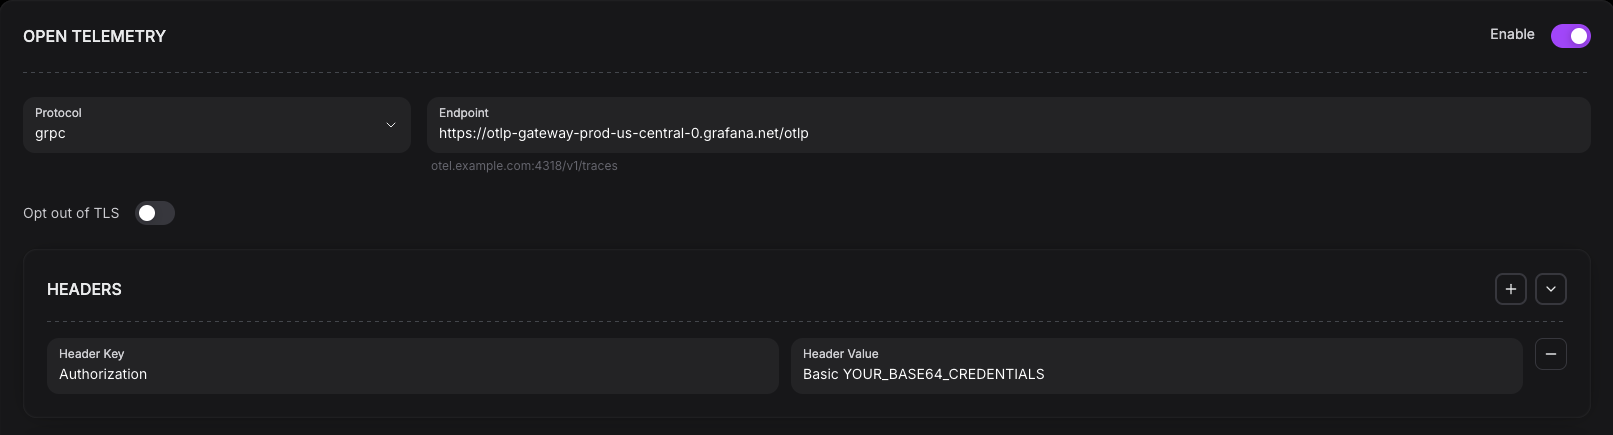
Testing Configuration
To test your configuration, log in to your account, perform some actions in a task, wait for the export interval, and verify that the data has arrived at your collector.Troubleshooting
If you aren’t getting any data in your collector, the easiest way to verify your integration is to enable the developer tools in your editor. To do this, open the webview developer tools. Once you’ve done so, if you perform some actions that trigger metrics and/or logs (such as doing a task with Cline), you will see error logs if any error occurs when sending the data to your collector. If you don’t see any logs, enable debug mode.Connection Errors
-
Verify endpoint is accessible:
- Check if insecure mode is needed by opting out of TLS
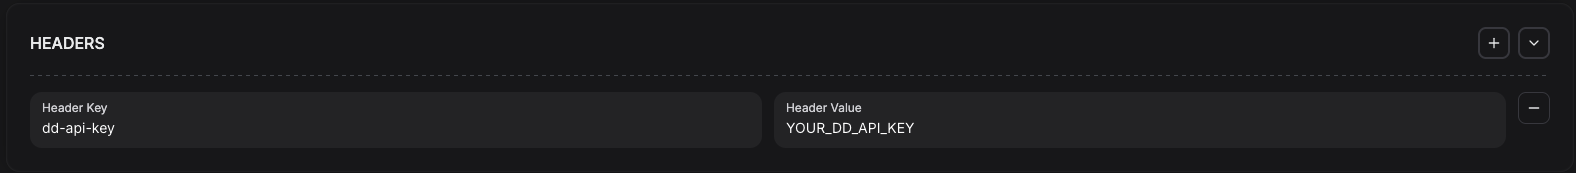
- Verify authentication headers: Double-check your API keys and authentication headers are correct
Debug Mode
Enable debug logging to see detailed OpenTelemetry information:- Configuration being used
- Exporters being created
- Connection attempts
- Export successes/failures
What Gets Exported
When OpenTelemetry is enabled, Cline exports:Metrics
- Feature usage counts
- Task execution metrics
- Error rates and types
- Performance measurements
Logs
- System events
- Error logs with context
- Operational information
Limitations
Current OpenTelemetry support in Cline:- ✅ OTLP metrics export (gRPC, HTTP)
- ✅ OTLP logs export (gRPC, HTTP)
- ✅ Basic configuration via Remote Configuration
- ❌ Distributed tracing (not yet implemented)
- ❌ Custom instrumentation API (not yet exposed)
- ❌ Sampling configuration (uses defaults)
Best Practices
- Test First: Always test with console exporter before sending to production
- Secure Credentials: Never hardcode API keys; use secure environment variable management
- Monitor Costs: Be aware of data ingestion costs with your observability platform
- Start Simple: Begin with metrics only, add logs if needed
- Use Compression: OTLP supports compression; check if your endpoint requires it
Next Steps
Event Reference
Complete catalog of all emitted OTel events
Cline Telemetry
Configure simple built-in telemetry
OpenTelemetry Docs
Learn more about OpenTelemetry